
How to Use Finviz India Stock Screener? Stock market research becomes easier now because the company filter is available based on price, financial performance, trading volume, and technical indicators.
Finviz India stock screener narrows a big list of companies to match your investment goals.
For those unaware, Finviz is a popular online stock screening and market research platform. It offers financial data, charts, heat maps, and customizable filters. Investors use the Finviz India stock screener to research US-listed stocks and explore international market trends. The platform, however, doesn’t cover Indian stock exchanges like NSE and BSE directly.
We’ll today talk about the complete process to use it, its features, and understand its limitations.
How to Use Finviz India Stock Screener?
Finviz India Stock Screener helps Indian investors research US-listed companies without checking the complete stock list. These steps must be followed to use it:
Step 1: Open the Finviz Website
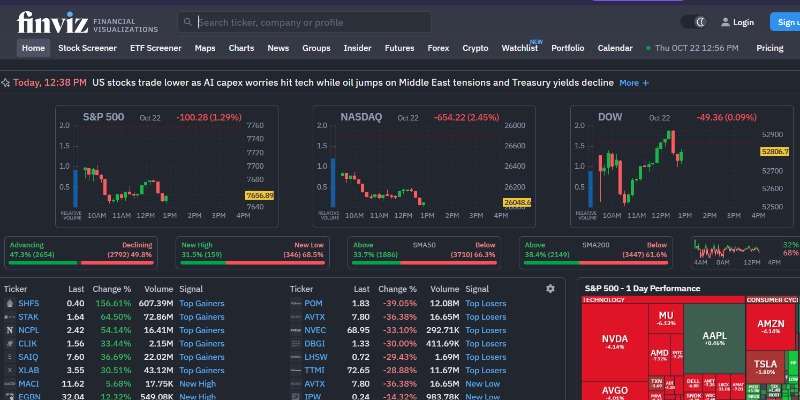
You must first visit Finviz’s official website to start exploring stock details. Many of its basic screening features can be explored here without purchasing a subscription.
Descriptive, Fundamental, and Technical are its main category of its filters. Although each is created for managing different purposes, they allow you to select companies based on your research strategy.
Step 2: Select Descriptive Filters
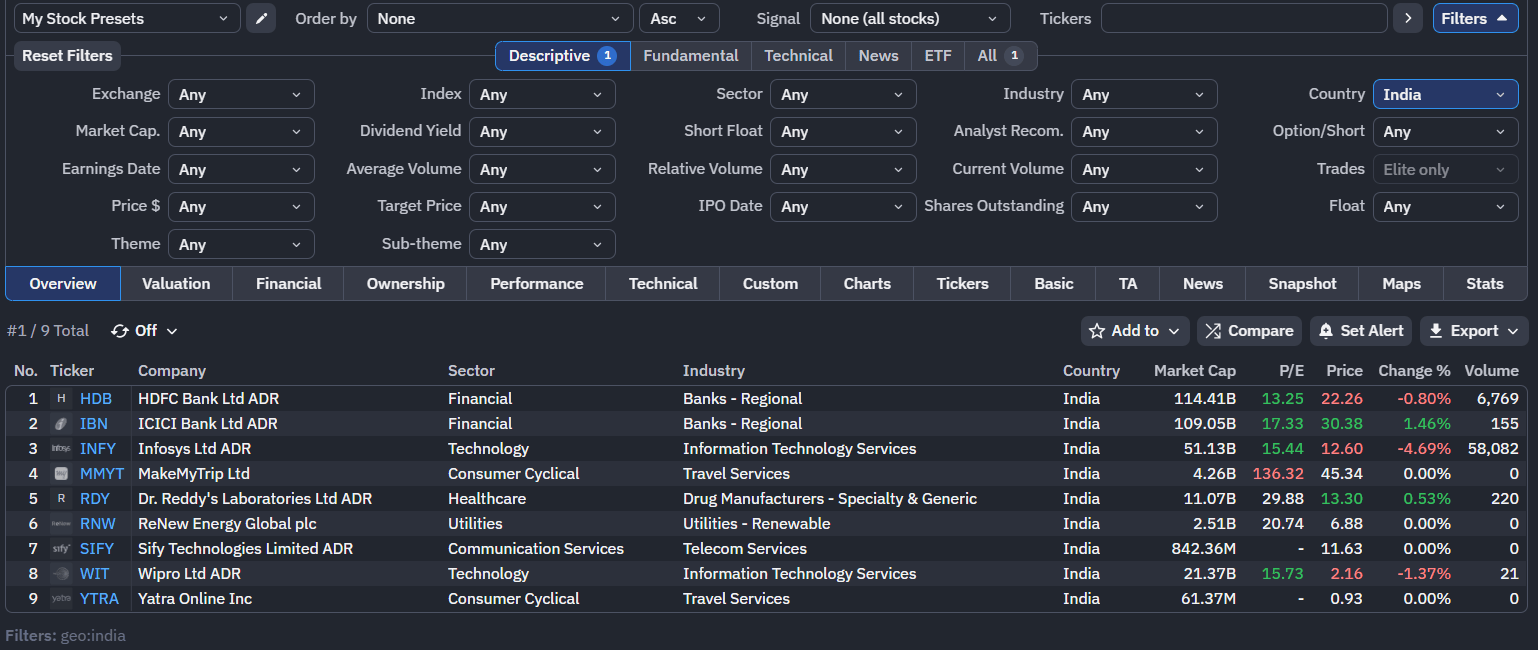
The list of stocks can be narrowed based on general company and market characteristics using the descriptive filters. You can select these criteria:
- Country: Find eligible companies based on their country classification.
- Sectors: Focus on different areas like technology, healthcare, etc.
- Industry: Make your search short for the particular business category.
- Market Capitalization: Select companies based on their total market value.
- Price: It sets a preferred price range.
- Average volume: It’s perfect for finding stocks with certain trading-level activity.
Suppose an investor selects the technology sector and a large market capitalization to find established American technology companies. In that case, these filters reduce the number of stocks needing further investigation.
Step 3: Apply Fundamental Filters
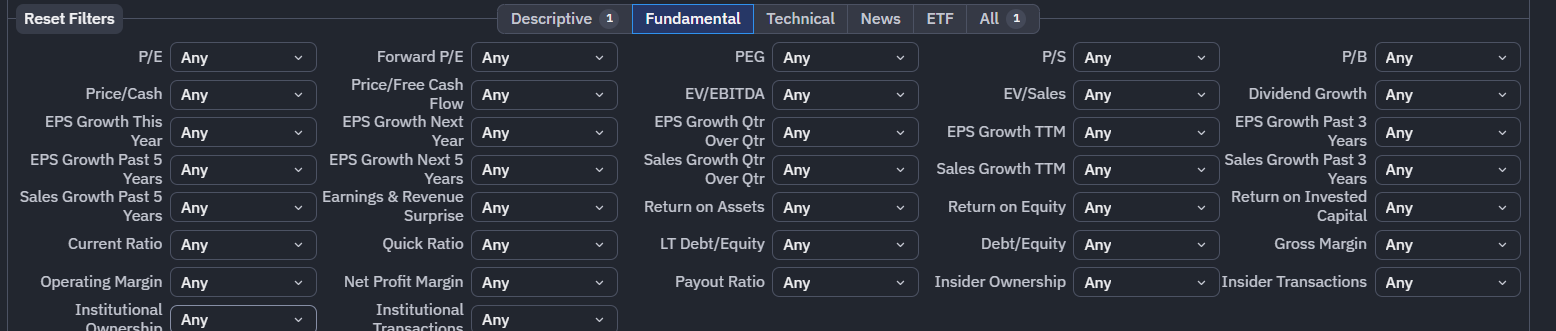
It is perfect for examining a company’s financial performance and valuation.
The price-to-earnings (P/E) ratio, earnings per share (EPS), return on equity, profit margins, and dividend yield are common available options here.
Suppose you are looking for profitable companies trading at reasonable valuations. In that case, you could screen for positive earnings, a suitable P/E ratio, and a consistent dividend history.
A low P/E, however, doesn’t mean a stock is undervalued. Companies within the same industry must be compared for more accurate results. You should also test their debt, revenue growth, and future earnings prospects before making a decision.
Step 4: Use Technical Filters
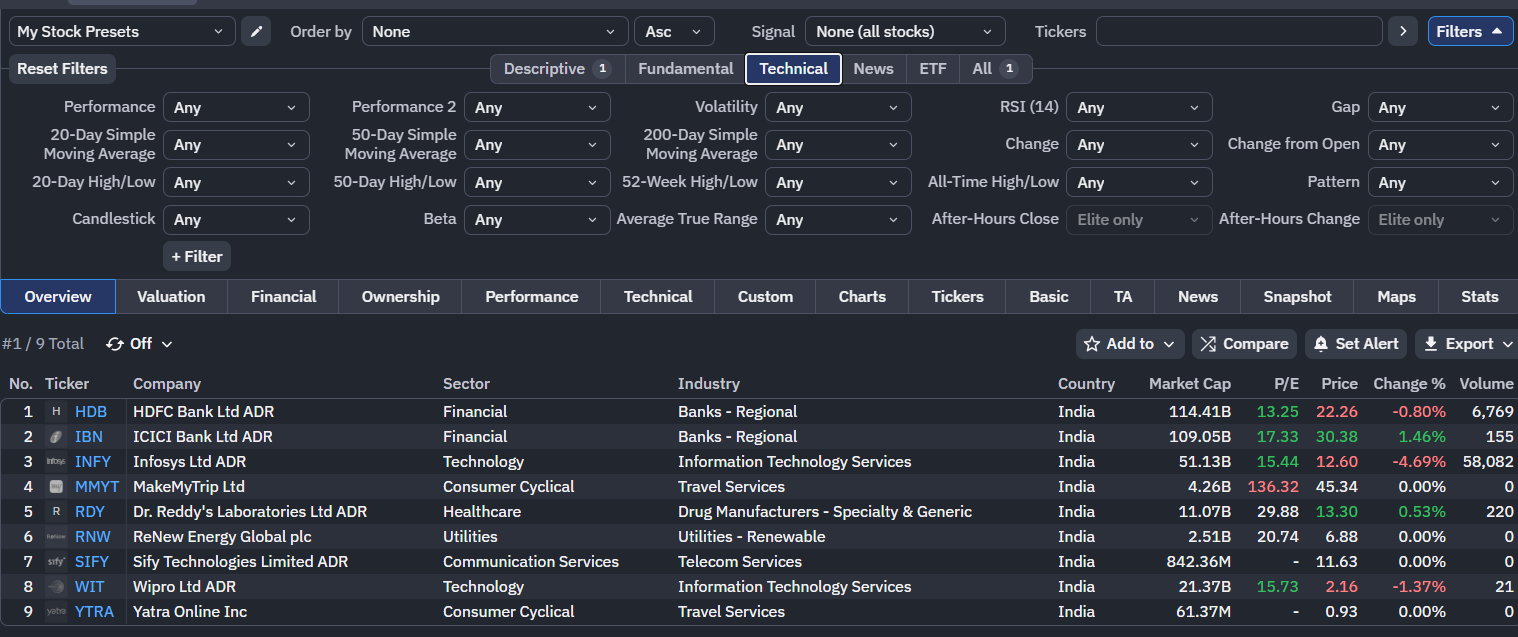
A company’s stock price behaviour and potential market trends can be studied using these filters. Strength index (RSI), moving averages, price performance, volatility, and gaps are some of the available indicators and measurements on Finviz India.
Suppose a trader examines price performance and moving-average signals to find stocks showing upward momentum. In that case, RSI helps assess whether recent price movements are unusually strong or weak.
These indicators should be considered together. But they should not be treated as independent buy or sell signals. Market news, trading volume, and broader market conditions may also affect them.
Step 5: Check Volume and Relative Volume

Trading volume shows how shares change hands during a specific period. Although high volume makes entering or exiting a position easier, liquidity depends on other market factors.
Relative volume, meanwhile, compares current trading activity with a stock’s average volume. Although a reading above 1 shows activity above the reference average, lower activity is indicated by a reading below 1.
These filters easily find stocks attracting unusual attention. You should, however, investigate whether the activity relates to earnings announcements, company news, etc before starting trading.
Step 6: Review the Results and Research Each Company
You should review the matching stocks in the results table after applying all filters. Examine the table based on company details, financial metrics, charts, and related news.
Don’t purchase a stock simply because it passes certain screening. Traders should read the company’s financial statements, check recent announcements, compare competitors, and consider the risks involved.
Currency fluctuations, brokerage charges, taxation, and the rules applicable to overseas investments must also be considered for investors located in India.
Key Features of Finviz for Indian Investors
Several features for different kinds of market research are available on Finviz India.
| Features | Their abilities |
| Stock screener | Find stocks based on chosen criteria |
| Heat maps | Market & sectors’ performance is shown here |
| Advanced charts | Technical analysis & price comparison are available |
| Fundamental filters | Examine valuation, earnings, and dividends |
| Technical filters | Find price patterns and momentum indicators |
| Alerts | Notify about the selected market events |
| Backtesting | Use historical data to evaluate certain technical trading strategies |
Feature availability depends on the plans purchased. You should therefore check the features available on each plan in the next section.
Finviz Free vs Finviz Elite
The free plan and the paid plan named Finviz Elite are available here. You should therefore consider your requirements before purchasing a plan.
| Features | Free | Elite |
| Stock screeners | Yes | Available with advanced mode |
| Basic charts | Yes | Yes with more charting tools |
| Market data | Delayed | Real-time quotes for supported markets |
| Advanced charts | Limited | Available |
| Alerts | Less | Available |
| Ads | Yes | No |
The free version is perfect for exploring screening tools and researching US companies. Its real-time data, advanced charting, and additional research features can be accessed at approximately ₹2369 per month through the Elite plan.
Read more: Sahi Trading App Review: Best for Option Trading, Really?
Investing Pro App Review 2026: Why I Stopped Using It?
Lemon Trading App Review (Lemonn): Lemon Brokerage Charges
FAQs
1. Is Finviz available in India?
Yes, it is available in India through a web browser. Its stock database, however, only covers the US market. The direct screening of Indian stocks like NSE- and BSE-listed shares is not available here.
2. Is the Finviz India stock screener free?
Yes, the stock screener with several filtering and research features is available here for free.
3. Can Finviz help beginners?
Yes, its preset filters, company data, charts, and heat maps are helpful features for beginners to learn about the US Market.
Conclusion
Finviz India is perfect for studying US-listed companies through financial filters, charts, heat maps, and market data. Although its free plan is a perfect starting point, extra tools for deep analysis are available here at the Elite plan.
Its market coverage is the biggest limitation here. Although the platform supports American stocks, it cannot replace a dedicated screener for NSE- and BSE-listed companies. You should therefore consider your target market, investment approach, and data requirements
You should always conduct your own research before investing.